工作中 CentOS 的一些笔记 03,其实大部分都是 Linux 通用。
[TOC]
Elasticsearch
安装
下载压缩版的 es 并解压运行:
wget https://artifacts.elastic.co/downloads/elasticsearch/elasticsearch-7.8.0-linux-x86_64.tar.gz # 下载
tar -xzvf elasticsearch-7.8.0-linux-x86_64.tar.gz # 解压

# 编辑 .bashrc,添加以下 ES 环境变量:
export ES_PATH="/home/bolitao/apps/elasticsearch-7.8.0"
export PATH=$ES_PATH/bin:$PATH
es 启动过程可能会出现以下错误:
max virtual memory areas vm.max_map_count [65530] is too low, increase to at least [262144]
[2]: the default discovery settings are unsuitable for production use; at least one of [discovery.seed_hosts, discovery.seed_providers, cluster.initial_master_nodes] must be configured
进行以下设置:
-
vim config/elasticsearch.yml # 设置以下行 network.host: 0.0.0.0 # 取消注释以下行: node.name: node-1 # 添加以下行: cluster.initial_master_nodes: ["node-1"] -
sudo vim /etc/sysctl.conf
# 添加以下行;
vm.max_map_count=655360

# 加载参数:
sudo sysctl -p
放行防火墙端口:
sudo firewall-cmd --zone=public --permanent --add-port=5601/tcp # kibana 端口
sudo firewall-cmd --zone=public --permanent --add-port=9200/tcp # es 通信端口
sudo firewall-cmd --reload
运行 es:
./elasticsearch-7.8.0-linux-x86_64./bin/elasticsearch
验证 ES 运行状态:
curl 192.168.188.130:9200


StatusCode        : 200
StatusDescription : OK
Content           : {
                      "name" : "node-1",
                      "cluster_name" : "elasticsearch",
                      "cluster_uuid" : "Qse9DW45TE2XhdsUfvk2fg",
                      "version" : {
                        "number" : "7.8.0",
                        "build_flavor" : "default",
                        "build_type" : "tar"...
RawContent        : HTTP/1.1 200 OK
...
Kibana 是 Elasticsearch 的数据可视化和管理工具,安装如下:
wget https://artifacts.elastic.co/downloads/kibana/kibana-7.8.0-linux-x86_64.tar.gz # 下载
tar -xzvf kibana-7.8.0-linux-x86_64.tar.gz # 解压


# 在 .bashrc 添加如下环境变量:
export KIBANA_PATH="/opt/kibana"
export PATH=$KIBANA_PATH/bin:$PATH
允许远程访问:
vim kibana-7.8.0-linux-x86_64/config/kibana.yml

# 设置以下行并重启 kibana
server.host: "0.0.0.0"
验证 Kibana 运行状态:

相关操作
-
查询健康度:
GET /_cat/health?v epoch timestamp cluster status node.total node.data shards pri relo init unassign pending_tasks max_task_wait_time active_shards_percent 1594630302 08:51:42 elasticsearch green 1 1 10 10 0 0 0 0 - 100.0% -
新增数据:
PUT /megacorp/employee/1 { "first_name" : "John", "last_name" : "Smith", "age" : 25, "about" : "I love to go rock climbing", "interests": [ "sports", "music" ] } # 返回数据如下: { "_index" : "megacorp", "_type" : "employee", "_id" : "1", "_version" : 8, "result" : "updated", "_shards" : { "total" : 2, "successful" : 1, "failed" : 0 }, "_seq_no" : 9, "_primary_term" : 1 } -
获得一条数据:
GET /megacorp/employee/1 { "_index" : "megacorp", ... "found" : true, "_source" : { "first_name" : "John", "last_name" : "Smith", "age" : 25, "about" : "I love to go rock climbing", "interests" : [ "sports", "music" ] } } -
删除数据:
DELETE /megacorp/employee/1 { "_index" : "megacorp", "_type" : "employee", "_id" : "1", "_version" : 15, "result" : "deleted", // 这是操作结果 "_shards" : { "total" : 2, "successful" : 1, "failed" : 0 }, "_seq_no" : 16, "_primary_term" : 1 } -
搜索数据:
GET /megacorp/employee/_search?q=last_name:Smith # 搜索 lastName 为 Smith 的雇员 { "took" : 322, "timed_out" : false, ... "hits" : { "total" : { "value" : 1, "relation" : "eq" }, "max_score" : 0.18232156, "hits" : [ { ... "_source" : { "first_name" : "Jane", "last_name" : "Smith", ... ] } } ] } } -
全文搜索(模糊搜索):
GET /megacorp/employee/_search
{
    "query" : {
        "match" : {
            "about" : "rock climbing"
        }
    }
}

// 结果如下:
{
  ...
  "hits" : {
    "total" : {
      "value" : 2,
      "relation" : "eq"
    },
    "max_score" : 0.8900273,
    "hits" : [
      {
        "_index" : "megacorp",
        "_type" : "employee",
        "_id" : "1",
        "_score" : 0.8900273,
        "_source" : {
          "first_name" : "John",
          "last_name" : "Smith",
          "age" : 25,
          "about" : "I love to go rock climbing",
          ...
        }
      },
      {
        "_score" : 0.29837534,
        "_source" : {
          "first_name" : "Jane",
          "last_name" : "Smith",
          "about" : "I like to collect rock albums",
          ...
      }
    ]
  }
}
从结果中可以看出,about 相关程度更高的结果 _score 字段的值更高。
PostgreSQL
安装
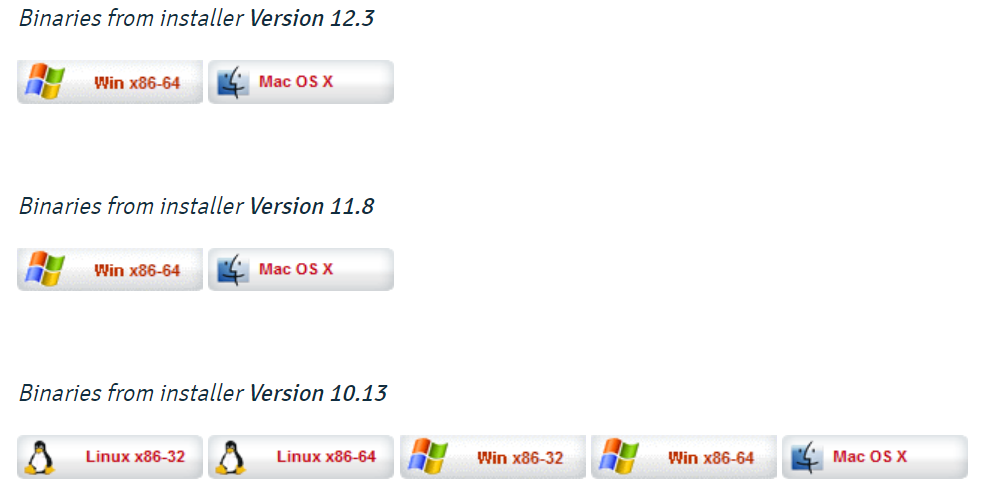
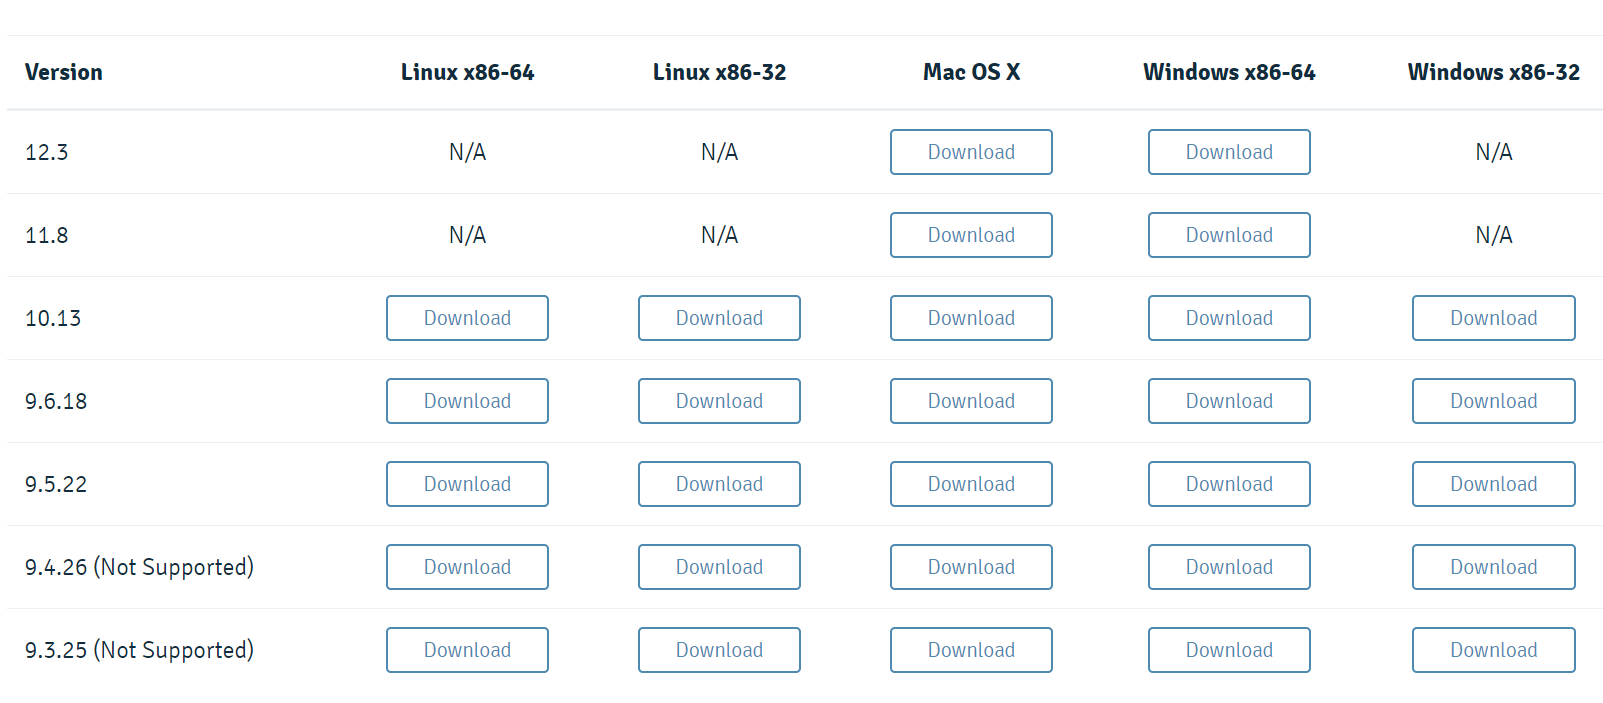
根据 PostgreSQL 官方文档 PostgreSQL: Linux downloads (other),二进制压缩包和 EDB 安装器方式都不再提供 10 以后的版本:
官方推荐使用对应发行版的包管理器进行安装,对于 RedHat 系发行版,按以下步骤安装 PostgreSQL 12:
sudo yum install https://download.postgresql.org/pub/repos/yum/reporpms/EL-7-x86_64/pgdg-redhat-repo-latest.noarch.rpm # 导入 pgsql 软件仓库
sudo yum install postgresql12-server # 安装 pgsql 12
sudo /usr/pgsql-12/bin/postgresql-12-setup initdb # 初始化 DB
# 以下是命令对应的输出:
Initializing database ... OK

sudo systemctl start postgresql-12 # 启动 pgsql
sudo systemctl status postgresql-12 # 查看 pgsql 运行状态
# 以下是命令对应的输出:
● postgresql-12.service - PostgreSQL 12 database server
   Loaded: loaded (/usr/lib/systemd/system/postgresql-12.service; disabled; vendor preset: disabled)
   Active: active (running) since 一 2020-07-13 09:20:55 CST; 7s ago
     Docs: https://www.postgresql.org/docs/12/static/
  Process: 2476 ExecStartPre=/usr/pgsql-12/bin/postgresql-12-check-db-dir ${PGDATA} (code=exited, status=0/SUCCESS)
 Main PID: 2482 (postmaster)
    Tasks: 8
   Memory: 18.0M
   CGroup: /system.slice/postgresql-12.service
           ...
配置 pgsql 密码:
sudo su - postgres
psql -c "alter user postgres with password '123'" # 设置 postgres 密码为 123
允许远程访问:
sudo vim /var/lib/pgsql/12/data/postgresql.conf
# 修改以下字段
listen_addresses = '*'

sudo vim /var/lib/pgsql/12/data/pg_hba.conf
# 文件末尾添加以下行:
host all all 0.0.0.0/0 md5
# 修改以下行,将 peer 改为 md5
local   all             all                                     md5

sudo systemctl restart postgresql-12 # 重启服务
配置防火墙,放行 pgsql 相关服务:
sudo firewall-cmd --add-service=postgresql12 --permanent --zone=public
sudo firewall-cmd --reload # 重载防火墙
在宿主机使用 psql 命令行访问虚拟机的 PostgreSQL:
PS C:\Users> psql -h 192.168.188.130 -W -U postgres -p 5432
口令:
psql (12.3)
输入 "help" 来获取帮助信息.

postgres=#
控制访问文件说明
ident:通过联系客户端上的ident服务器获取客户端的操作系统用户名,并检查它是否与请求的数据库用户名匹配。 Ident 身份验证只能用于 TCP / IP 连接,为本地连接指定时,将使用对等身份验证peer:从操作系统获取客户端的操作系统用户名,并检查它是否与请求的数据库用户名匹配,仅适用于本地连接md5:执行 SCRAM-SHA-256 或 MD5 身份验证以验证用户的密码。
Linux 额外学习
journalctl
从尾部滚动查看 systemd 日志:sudo journalctl -f。
查看某个由 systemd 管理的服务的日志:sudo journalctl --unit xxx。
比如查看 Tengine 的日志:
➜ sudo journalctl --unit nginx
-- Logs begin at 一 2020-07-13 08:21:13 CST, end at 一 2020-07-13 08:42:21 CST. --
7月 13 08:21:21 localhost.localdomain systemd[1]: Starting Tengine/nginx...
7月 13 08:21:21 localhost.localdomain nginx[1195]: nginx: the configuration file /usr/local/nginx/conf/nginx.conf syntax is ok
7月 13 08:21:21 localhost.localdomain nginx[1195]: nginx: configuration file /usr/local/nginx/conf/nginx.conf test is successful
7月 13 08:21:21 localhost.localdomain systemd[1]: Started Tengine/nginx.
查看错误时常用的 sudo journalctl -xe 方法:-x 表示提供有用的帮助,-e 表示从尾部开始读。
PostgreSQL 补充
相关操作
-
psql -h <ip> -W -U <用户> -p <端口> -d <数据库>:连接某 ip 机器上的 pgsql,-W选项表示使用自动密码提示 -
创建用户
postgres=# create user bolitao with password '123'; # 创建 bolitao  用户
CREATE ROLE

postgres=# create database testdb owner bolitao; # 创建 testdb 库,所有权赋给 bolitao
CREATE DATABASE

postgres=# grant all privileges on database testdb to bolitao; # 将对 testdb 的所有权限赋给 bolitao
GRANT
之后便可用 psql 以
bolitao用户身份访问testdb数据库:psql -U bolitao -W -d testdb -
查看所有库
\l:testdb=> \l 数据库列表 名称 | 拥有者 | 字元编码 | 校对规则 | Ctype | 存取权限 -----------+----------+----------+-------------+-------------+----------------------- postgres | postgres | UTF8 | zh_CN.UTF-8 | zh_CN.UTF-8 | template0 | postgres | UTF8 | zh_CN.UTF-8 | zh_CN.UTF-8 | =c/postgres + | | | | | postgres=CTc/postgres template1 | postgres | UTF8 | zh_CN.UTF-8 | zh_CN.UTF-8 | =c/postgres + | | | | | postgres=CTc/postgres testdb | bolitao | UTF8 | zh_CN.UTF-8 | zh_CN.UTF-8 | =Tc/bolitao + | | | | | bolitao=CTc/bolitao (4 行记录) -
查看表及其结构:
-- \d:列出当前数据库的所有表格 testdb=> \d 关联列表 架构模式 | 名称 | 类型 | 拥有者 ----------+---------+--------+--------- public | user_tb | 数据表 | bolitao (1 行记录) -- \d [table_name]:列出某一张表格的结构 testdb=> \d user_tb; 数据表 "public.user_tb" 栏位 | 类型 | 校对规则 | 可空的 | 预设 ------+-----------------------+----------+--------+------ name | character varying(30) | | | age | integer | | | -
PostgreSQL 遵循 SQL 标准,对表、数据的常用增删改查语法和 MySQL、SQL Server 无异
数据备份和恢复
PostgreSQL 官方提供的备份 cli 工具是 pg_dump,数据恢复工具是 pg_restore。
-
备份库:
pg_dump -U bolitao testdb > test.sql # 将 testdb 库的数据备份至 test.sql 文件 -
备份特定表(
-t参数):pg_dump -U bolitao -t user_tb testdb > user_tb.sql # 将 testdb 的 user_tb 表数据备份至 user_tb.sql 文件 -
恢复数据(使用
psql):psql -U postgres -d testdb2 -f test.sql # 将 test.sql 备份的库数据恢复到 testdb2 库 psql -U postgres -d testdb2 -f user_tb.sql # 将备份的表数据恢复到 testdb2 库
FastDFS
单机模式安装
安装编译和运行依赖:
sudo yum install git gcc gcc-c++ make automake autoconf libtool pcre pcre-devel zlib zlib-devel openssl-devel wget vim -y
安装 libfastcommon:
cd /usr/local/src
sudo git clone https://github.com/happyfish100/libfastcommon.git --depth 1
cd libfastcommon
sudo ./make.sh # 编译
sudo ./make.sh install # 安装
安装 FastDFS:
cd ..
sudo git clone https://github.com/happyfish100/fastdfs.git --depth 1
cd fastdfs
sudo ./make.sh && sudo ./make.sh install # 编译并安装
# 配置文件准备
sudo cp /etc/fdfs/tracker.conf.sample /etc/fdfs/tracker.conf
sudo cp /etc/fdfs/storage.conf.sample /etc/fdfs/storage.conf
sudo cp /etc/fdfs/client.conf.sample /etc/fdfs/client.conf # 客户端文件,测试用
sudo cp /usr/local/src/fastdfs/conf/http.conf /etc/fdfs/ # 供 nginx 访问使用
sudo cp /usr/local/src/fastdfs/conf/mime.types /etc/fdfs/ # 供 nginx 访问使用
为 nginx 编译 fastDFS插件:
# 下载插件
cd ~/source
git clone https://github.com/happyfish100/fastdfs-nginx-module.git --depth 1
sudo cp fastdfs-nginx-module/src/mod_fastdfs.conf /etc/fdfs

# 重新编译 Tengine
cd /home/bolitao/tengine-2.3.2

# 设置编译选项,新增 fastdfs 插件
./configure --user=app \
--group=app \
--with-jemalloc=/home/bolitao/jemalloc-5.2.1 \
--add-module=./modules/ngx_http_upstream_check_module \
--add-module=/home/bolitao/source/fastdfs-nginx-module/src

make
停止并重新安装 Tengine:
sudo systemctl stop nginx
sudo make install

# 查看 nginx 信息,检查是否有 FastDFS 插件
➜  tengine-2.3.2 sudo /usr/local/nginx/sbin/nginx -V
Tengine version: Tengine/2.3.2
...
configure arguments: --user=app --group=app --with-jemalloc=/home/bolitao/jemalloc-5.2.1 --add-module=./modules/ngx_http_upstream_check_module --add-module=/home/bolitao/source/fastdfs-nginx-module/src
修改 tracker 配置:
sudo vim /etc/fdfs/tracker.conf

# 修改以下内容
port=22122  # tracker 服务器端口
base_path=/home/dfs  # 存储日志和数据的根目录
修改 storage 配置:
sudo vim /etc/fdfs/storage.conf

# 修改以下内容
port=23000  # storage 服务端口
base_path=/home/dfs  # 数据和日志文件存储根目录
store_path0=/home/dfs  # 第一个存储目录
tracker_server=192.168.15.130:22122  # tracker 服务器 IP 和端口
http.server_port=8888  # http 访问文件的端口(和 nginx 中保持一致)
防火墙放行:
sudo firewall-cmd --zone=public --permanent --add-port=22122/tcp
sudo firewall-cmd --zone=public --permanent --add-port=23000/tcp
sudo firewall-cmd --zone=public --permanent --add-port=8888/tcp
sudo firewall-cmd --reload
启动 tracker 和 storage:
sudo /etc/init.d/fdfs_trackerd start
sudo /etc/init.d/fdfs_storaged start
测试客户端:
sudo vim /etc/fdfs/client.conf
# 修改以下内容
base_path=/home/dfs
tracker_server=192.168.15.130:22122 # tracker 服务器 IP 和端口
# 进行文件上传测试
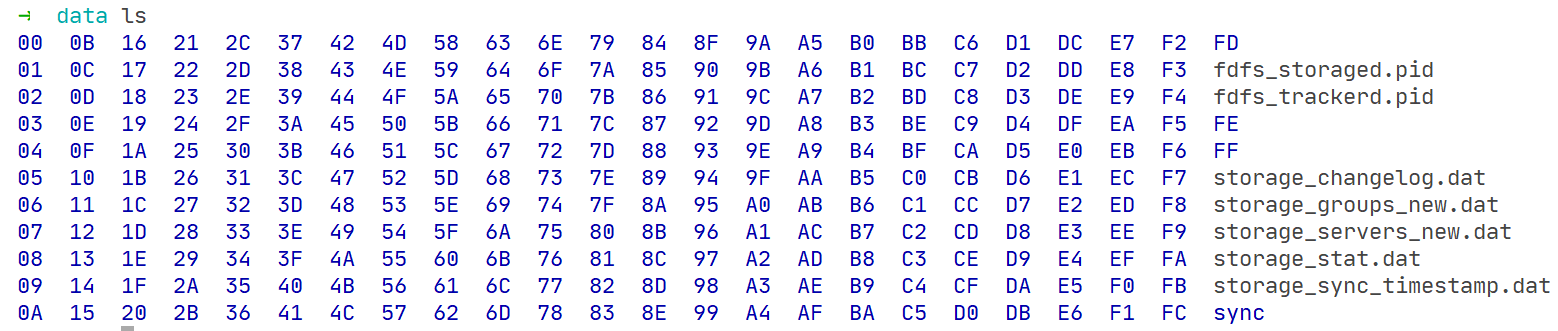
➜ sudo fdfs_upload_file /etc/fdfs/client.conf /home/bolitao/apps/apache-tomcat-9.0.37/BUILDING.txt
group1/M00/00/00/wKi8gl8NE5yAFQc7AABKJvC0Vqw094.txt
上传文件后数据保存路径如下图所示:
配置 nginx 访问:
sudo vim /etc/fdfs/mod_fastdfs.conf

# 修改以下内容:
tracker_server=192.168.15.130:22122
url_have_group_name=true
store_path0=/home/dfs

# 配置 nginx:
sudo vim /usr/local/nginx/conf/nginx.conf

# 添加以下配置:
server {
    listen       8888;    ## 该端口和 storage.conf 中的 http.server_port 相同
    server_name  localhost;
    location ~/group[0-9]/ {
        ngx_fastdfs_module;
    }
    error_page   500 502 503 504  /50x.html;
    location = /50x.html {
    root   html;
    }
}

sudo /usr/local/nginx/sbin/nginx -t # 测试 nginx 配置无误
sudo systemctl restart nginx.service # 重启 Tengine
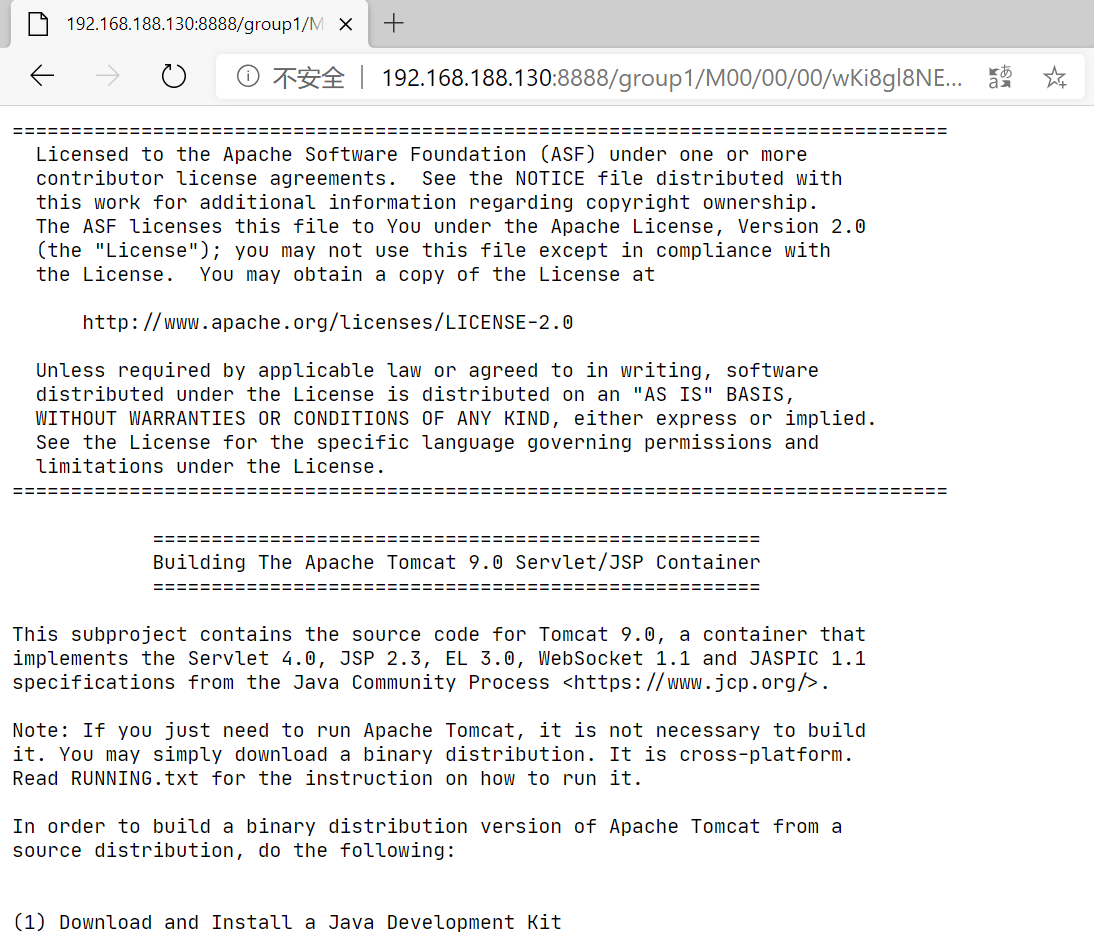
测试:通过宿主机访问刚在上传的文件(地址为 http://192.168.188.130:8888/group1/M00/00/00/wKi8gl8NE5yAFQc7AABKJvC0Vqw094.txt ),发现如下图所示(如果是二进制文件则会直接弹出下载):
集群安装和配置
准备三台服务器,其 IP 为 192.168.15.130、192.168.15.131、192.168.15.132(简记为 130、131、132)。三台服务器均已安装 FastDFS tracker、FastDFS storage、FastDFS client 和 Tengine。
-
修改三台机器的 tracker 配置:
sudo vim /etc/fdfs/tracker.conf # 修改以下内容 port=22122 # tracker 服务器端口 base_path=/home/dfs # 存储日志和数据的根目录 -
修改三台机器的 storage 配置:
sudo vim /etc/fdfs/storage.conf

# 修改以下配置
tracker_server = 192.168.15.130:22122
tracker_server = 192.168.15.131:22122
tracker_server = 192.168.15.132:22122
port=23000
base_path=/home/dfs
store_path0=/home/dfs
http.server_port=8888
重启 tracker 和 storage 服务,检查是否 storage 服务器是否登记到 tracker:
sudo /etc/init.d/fdfs_trackerd restart # 重启 tracker 服务
sudo /etc/init.d/fdfs_storaged restart # 重启 storage 服务

sudo /usr/bin/fdfs_monitor /etc/fdfs/storage.conf # 检查服务状态
# 以下是输出,省略部分非关键信息
...
tracker server is 192.168.15.132:22122

group count: 1

Group 1:
group name = group1
...
        Storage 1:
                id = 192.168.15.130
                ip_addr = 192.168.15.130  ACTIVE
                http domain =
                version = 6.06
                join time = 2020-07-14 10:08:26
                up time = 2020-07-14 15:57:34
...
        Storage 2:
                id = 192.168.15.131
                ip_addr = 192.168.15.131  ACTIVE
                http domain =
                version = 6.06
...
        Storage 3:
                id = 192.168.15.132
                ip_addr = 192.168.15.132  ACTIVE
                http domain =
                version = 6.06
可以看到三台存储服务器都处于激活状态,多运行几次
fdfs_monitor命令会发现tracker server有所变换,即多个 tracker 的切换功能也是生效的。 -
测试 client,修改 client 配置文件:
sudo vim /etc/fdfs/client.conf

# 需要修改的内容如下:
base_path=/home/moe/dfs
tracker_server = 192.168.15.130:22122
tracker_server = 192.168.15.131:22122
tracker_server = 192.168.15.132:22122
测试 client 文件上传:
fdfs_upload_file /etc/fdfs/client.conf /home/bolitao/apps/screenfetch/screenfetch-dev
# 返回上传的文件位置和文件名:
group1/M00/00/00/wKgPgl8Nau-AcXEFAAPBDqCqwtI9997099
由于三台 storage 处于同一 group,组内文件互备,所以可以在三台存储服务器中发现上传的文件:
ls -l /home/dfs/data/00/00 # 列出文件 # 以下是命令输出: -rw-r--r-- 1 root root 246030 7月 14 16:21 wKgPgl8Nau-AcXEFAAPBDqCqwtI9997099 -
配置 nginx 访问,修改服务器的
/etc/fdfs/mod_fastdfs.conf文件:tracker_server = 192.168.15.130:22122 tracker_server = 192.168.15.131:22122 tracker_server = 192.168.15.132:22122 url_have_group_name=true store_path0=/home/dfs在 nginx 中添加以下 server:
server {
    listen       8888;    ## 该端口为storage.conf中的http.server_port相同
    server_name  localhost;
    location ~/group[0-9]/ {
        ngx_fastdfs_module;
    }
    error_page   500 502 503 504  /50x.html;
    location = /50x.html {
    root   html;
    }
}
重启三台 nginx 后,可在三台服务器下载文件,比如访问
http://192.168.15.130:8888/group1/M00/00/00/wKgPgl8Nau-AcXEFAAPBDqCqwtI9997099(或其他两个 host),会弹出下载对话框: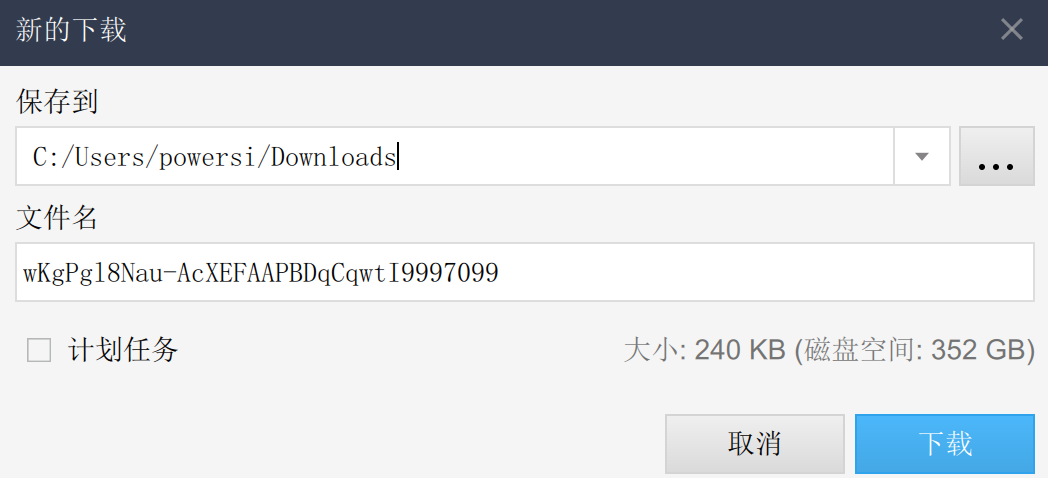
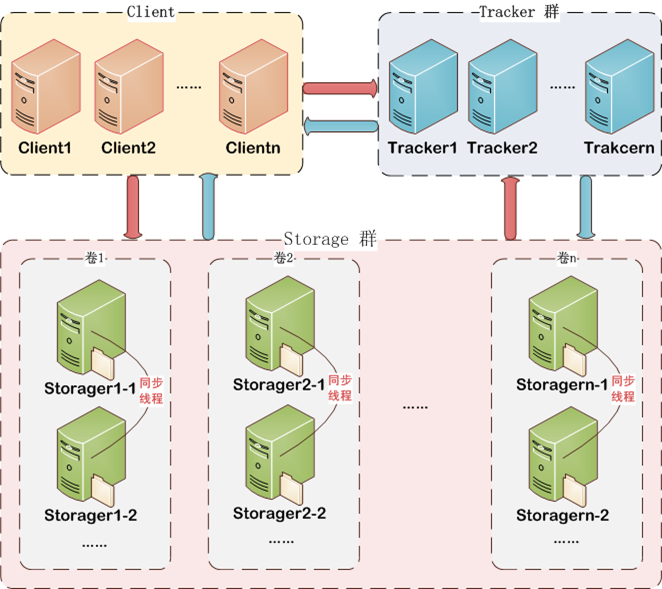
备注:这里配置了三台服务器既作 tracker 服务器也作存储服务器。实际运用时更多情况是将 tracker 和 storage 划分,tracker 用作负载均衡和调度,storage 用来存储,如下图所示:
基本操作
-
tracker 服务管理:
sudo /etc/init.d/fdfs_trackerd start # 启动 tracker 服务 sudo /etc/init.d/fdfs_trackerd restart # 重启动 tracker 服务 sudo /etc/init.d/fdfs_trackerd stop # 停止 tracker 服务 sudo chkconfig fdfs_trackerd on # 自启动 tracker 服务 -
storage 服务管理:
sudo /etc/init.d/fdfs_storaged start # 启动 storage 服务 sudo /etc/init.d/fdfs_storaged restart # 重启 storage 服务 sudo /etc/init.d/fdfs_storaged stop # 停止 storage 服务 sudo chkconfig fdfs_storaged on # 自启动 storage 服务 -
检查集群(会输出所有服务器的信息):
sudo /usr/bin/fdfs_monitor /etc/fdfs/storage.conf # 以下是命令输出: [sudo] bolitao 的密码: [2020-07-14 10:24:49] DEBUG - base_path=/home/dfs, connect_timeout=5, network_timeout=60, tracker_server_count=1, anti_steal_token=0, anti_steal_secret_key length=0, use_connection_pool=1, g_connection_pool_max_idle_time=3600s, use_storage_id=0, storage server id count: 0 server_count=1, server_index=0 tracker server is 192.168.188.130:22122 group count: 1 Group 1: group name = group1 disk total space = 48,096 MB disk free space = 44,515 MB trunk free space = 0 MB storage server count = 1 active server count = 1 storage server port = 23000 storage HTTP port = 8888 store path count = 1 subdir count per path = 256 current write server index = 0 current trunk file id = 0 ... -
上传:使用
fdfs_upload_file命令,命令跟的第一个参数表示客户端配置文件,第二个参数表示要上传的文件,比如:sudo fdfs_upload_file /etc/fdfs/client.conf /home/bolitao/apps/apache-tomcat-9.0.37/BUILDING.txt -
下载:使用
fdfs_download_file命令进行下载,第一个参数是客户端配置文件,第二个参数是要下载的文件,比如:fdfs_download_file /etc/fdfs/client.conf group1/M00/00/00/wKi8gl8NE5yAFQc7AABKJvC0Vqw094.txt -
删除:使用
fdfs_delete_file命令进行文件删除,第一个参数是配置文件,第二个参数是要删除的文件,比如:fdfs_delete_file /etc/fdfs/client.conf group1/M00/00/00/wKi8gl8NE5yAFQc7AABKJvC0Vqw094.txt # 再次下载该文件 fdfs_download_file /etc/fdfs/client.conf group1/M00/00/00/wKi8gl8NE5yAFQc7AABKJvC0Vqw094.txt # 提示文件不存在 [2020-07-14 10:39:16] ERROR - file: tracker_proto.c, line: 50, server: 192.168.188.130:23000, response status 2 != 0 [2020-07-14 10:39:16] ERROR - file: ../client/storage_client.c, line: 598, fdfs_recv_header fail, result: 2 download file fail, error no: 2, error info: No such file or directory -
设置多个组:
-
修改
/etc/fdfs/storage.conf文件中:store_path_count的值- 新增
store_path,比如store_path1、store_path2
-
修改
mod_fastdfs.conf文件:-
store_path_count的值 -
store_pathx的值 -
仿照 group 添加更多 group,比如:
[group1]
group_name=group1
storage_server_port=23000
store_path_count=3
store_path0=/home/dfs/data/group1/M00
store_path1=/home/dfs/data/group1/M01

[group2]
group_name=group2
storage_server_port=23000
store_path_count=3
store_path0=/home/dfs/data/group2/M00
store_path1=/home/dfs/data/group2/M01
-
-
修改 nginx 反向代理配置:
location ~/group[0-9]/M00 {
    root /home/dfs/data/group1
    ngx_fastdfs_module;
}

location ~/group[0-9]/M01 {
    root /home/dfs/data/group2
    ngx_fastdfs_module;
}
-
Kafka
安装(单机模式)
下载并解压:
wget https://mirror.bit.edu.cn/apache/kafka/2.5.0/kafka_2.12-2.5.0.tgz
tar -xzf kafka_2.12-2.5.0.tgz
cd kafka_2.12-2.5.0
修改 Kafka 配置,允许删除 topic:
vim config/server.properties

# 修改/在文件末添加如下行:
delete.topic.enable = true
为当前用户添加环境变量:
vim ~/.bashrc # 或者是 ~/.zshrc

# 添加以下内容:
export KAFKA_PATH="/home/bolitao/apps/kafka_2.12-2.5.0"
export PATH=$KAFKA_PATH/bin:$PATH

# 刷新
source ~/.bashrc
将 Kafka 注册为系统服务:
sudo vim /etc/systemd/system/kafka.service

# systemd 配置文件内容
[Unit]
Requires=zookeeper.service
After=zookeeper.service

[Service]
Type=simple
User=bolitao
ExecStart=/bin/sh -c '/home/bolitao/apps/kafka_2.12-2.5.0/bin/kafka-server-start.sh /home/bolitao/apps/kafka_2.12-2.5.0/config/server.properties > /home/bolitao/apps/kafka_2.12-2.5.0/logs/kafka.log 2>&1'
ExecStop=/home/kafka/kafka/bin/kafka-server-stop.sh
Restart=on-abnormal

[Install]
WantedBy=multi-user.target
启动 ZooKeeper:
sudo systemctl start zookeeper.service
启动 Kafka 服务:
sudo systemctl start kafka # 启动服务
sudo journalctl -u kafka # 查看 kafka 启动日志
less /home/bolitao/apps/kafka_2.12-2.5.0/logs/kafka.log # 查看 kafka 运行日志
集群安装和操作
为了便于操作,本节使用单机多实例方式进行集群操作。
-
设置多份配置文件
cp server.properties server-1.properties
cp server.properties server-2.properties
配置文件内容分别设置如下:
# server-1 的配置 broker.id=1 listeners=PLAINTEXT://:9093 log.dirs=/tmp/kafka-logs-1 # server-2 的配置 broker.id=2 listeners=PLAINTEXT://:9094 log.dirs=/tmp/kafka-logs-2 -
启动新的两个 Kafka 实例
kafka-server-start.sh ./server-1.properties kafka-server-start.sh ./server-2.properties -
加上上一步,共有 3 个 kafka 实例,之后创建一个
replication-factor为 3 的 Topic,topic 名为my-replicated-topic:kafka-topics.sh --create --bootstrap-server localhost:9092 --replication-factor 3 --partitions 1 --topic my-replicated-topic # 以下是命令输出: Created topic my-replicated-topic. -
查看 9092 端口的 my-replicated-topic 描述:
kafka-topics.sh --describe --bootstrap-server localhost:9092 --topic my-replicated-topic
# 以下是命令输出:
Topic: my-replicated-topic      PartitionCount: 1       ReplicationFactor: 3    Configs: segment.bytes=1073741824
        Topic: my-replicated-topic      Partition: 0    Leader: 1       Replicas: 1,0,2 Isr: 1,0,2
leader 负责给定分区的所有读写操作的节点,在上面的输出中可以看到 ldeade 为 1。
replicas 是复制的节点列表,主节点也会在这个列表里。
isr 全意
"in-sync" replicas,正常运行且同步状态已和 leader 一致的 replicas 将会出现在 isr 列表。partition leader 的重新选举操作会在 isr 节点中进行。 -
使用生产者发布一些信息:
kafka-console-producer.sh --bootstrap-server localhost:9092 --topic my-replicated-topic >my test message 1 >my test message 2 -
使用消费者查看信息:
kafka-console-consumer.sh --bootstrap-server localhost:9092 --from-beginning --topic my-replicated-topic my test message 1 my test message 2 -
测试集群容错性,杀死刚才作为 leader、id 为 1 的 kafka 进程:
ps aux | grep server-1.propertie bolitao 3691 2.4 21.7 4747716 404952 pts/0 Sl+ 14:50 0:37 /usr/lib/jvm/jdk1.8.0_251/bin/java... ... kill -9 3691 -
之后再次查看 my-replicated-topic 的描述:
kafka-topics.sh --describe --bootstrap-server localhost:9092 --topic my-replicated-topic
# 以下是命令行输出:
Topic: my-replicated-topic      PartitionCount: 1       ReplicationFactor: 3    Configs: segment.bytes=1073741824
        Topic: my-replicated-topic      Partition: 0    Leader: 0       Replicas: 1,0,2 Isr: 0,2
可以看到
Leader已被选举为 0,Isr中 1 已掉线,目前跟上同步进度且仍存活的节点为 0 和 2 -
重新运行消费者,使用
--from-beginning选项从头消费数据,可以看到即使之前 id 为 1 的主节点下线,消费者仍能够获取信息,没有造成数据丢失:kafka-console-consumer.sh --bootstrap-server localhost:9092 --from-beginning --topic my-replicated-topic my test message 1 my test message 2
其他基本操作
-
创建一个 topic:
kafka-topics.sh --create --zookeeper localhost:2181 --replication-factor 1 --partitions 1 --topic TestTopic # 输出如下: Created topic TestTopic. -
生产者发布一条 string 到
TestTopic:echo "Hello, World" | kafka-console-producer.sh --broker-list localhost:9092 --topic TestTopic > /dev/null -
消费者处理一条消息,使用
--from-beginning选项可以让消费者获取之前 Topic 的消息:kafka-console-consumer.sh --bootstrap-server localhost:9092 --topic TestTopic --from-beginning # 会有如下输出: Hello, World # 当使用 CTRL+C 停止该消费者时,会提示共处理了 TestTopoc 中的消息条数: Processed a total of 1 messages -
关于集群的操作学习在上一节已有部分笔记
网络
netstat
--numeric , -n
    Show numerical addresses instead of trying to determine symbolic host, port or user names.
-l, --listening
    Show only listening sockets.  (These are omitted by default.)
-p, --program
    Show the PID and name of the program to which each socket belongs.
--udp, -u
--tcp, -t
-a, --all
	Show both listening and non-listening (for TCP this means established connections) sockets. With the --interfaces  option, show interfaces that are not up
-o, --timers
	Include information related to networking timers.
-
netstat -nlptp | grep port:查看状态为 listening 的 TCP、UDP 连接。
netstat -nlptu | grep 3306 tcp6 0 0 :::3306 :::* LISTEN 2910/mysqld -
netstat -ap | grep appName:查看某应用占用的端口。
netstat -ap | grep mysql tcp 6247793 0 localhost.localdo:43546 172.18.20.105:mysql ESTABLISHED 2910/mysqld tcp6 0 0 [::]:mysql [::]:* LISTEN 2910/mysqld tcp6 0 0 localhost.localdo:mysql 172.18.20.105:6858 ESTABLISHED 2910/mysqld tcp6 0 0 localhost.localdo:58079 172.18.20.105:mysql ESTABLISHED 17100/java unix 2 [ ACC ] STREAM LISTENING 20294 2910/mysqld /tmp/mysql.sock -
netstat -an | grep port:查看某端口的使用情况。
netstat -an | grep 3306
tcp   6247793      0 172.18.20.106:43546     172.18.20.105:3306      ESTABLISHED
tcp6       0      0 :::3306                 :::*                    LISTEN
tcp6       0      0 172.18.20.106:3306      172.18.20.105:6858      ESTABLISHED
tcp6       0      0 172.18.20.106:58079     172.18.20.105:3306      ESTABLISHED
ss
-t, --tcp
	Display TCP sockets.
-u, --udp
	Display UDP sockets.
-a, --all
	Display both listening and non-listening (for TCP this means established connections) sockets.
-n, --numeric
    Do not try to resolve service names.
-l, --listening
    Display only listening sockets (these are omitted by default).
-p, --processes
    Show process using socket.
ss -atuss -nlptuss -apss -np
lsof
Redis
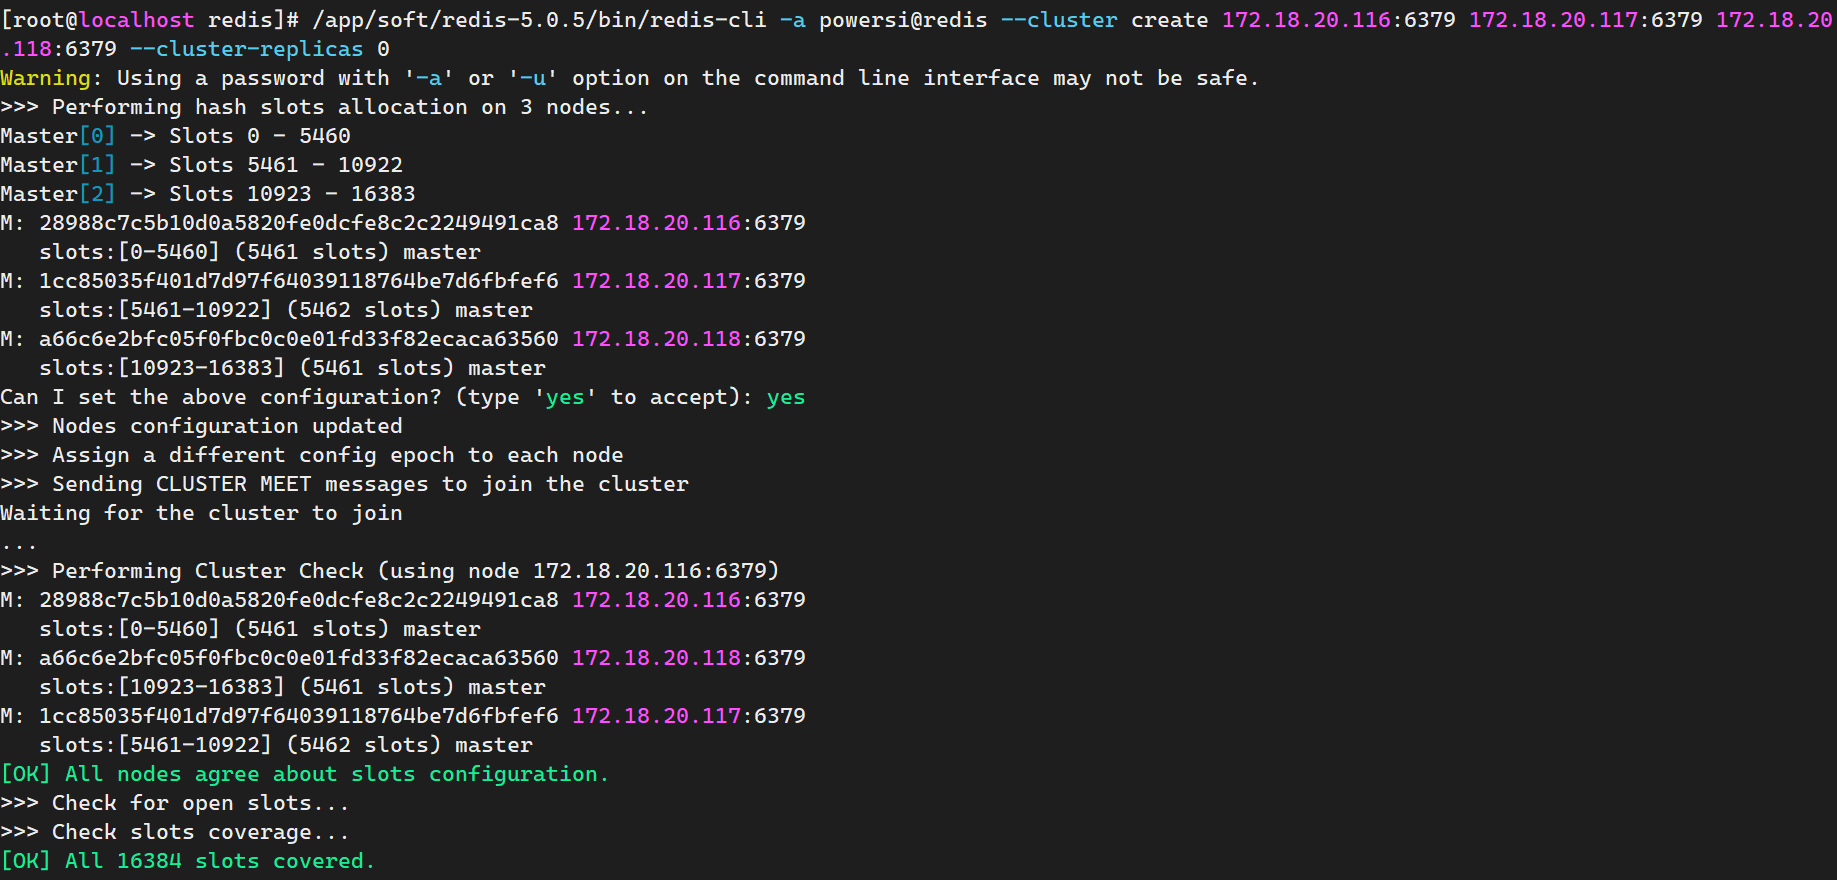
Cluster
/app/soft/redis-5.0.5/bin/redis-cli -a password@redis --cluster create 172.18.20.116:6379 172.18.20.117:6379 172.18.20.118:6379 --cluster-replicas 0